AI demand forecasting
The best-performing model for each SKU.
Demandlens tests multiple forecasting models against each SKU's history, selects the strongest performer dynamically, and shows whether the resulting forecast is reliable enough to act on.
Thirty minutes, on a working system. Nothing to install, and no data needed from you.
One model doesn't fit every SKU.
Demand patterns differ. A method that performs well for one SKU may perform poorly for another, and the best choice can change over time.
Where planning relies on one method across the portfolio, whether it is still the right one for each individual item is rarely visible in the monthly run.
How it works
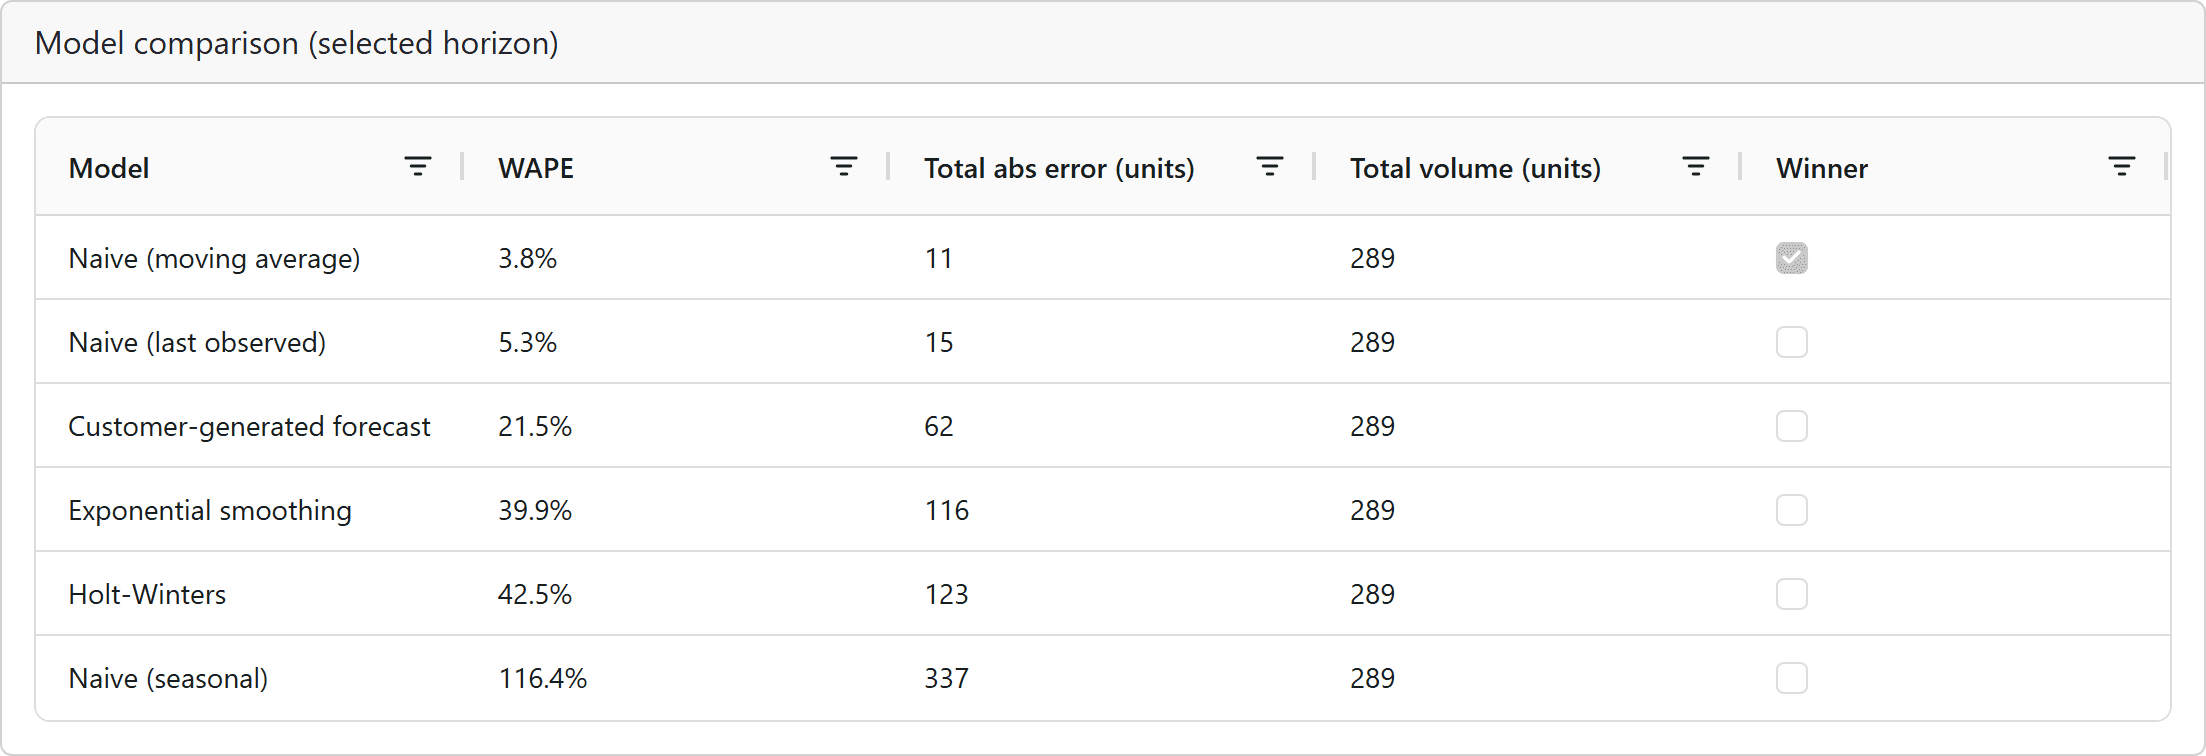
For each SKU and each forecast horizon, Demandlens backtests multiple candidate models using only information that would have been available at the time. It selects the best-performing model for that SKU and horizon, produces the forward forecast, and assesses the quality and reliability of that forecast. Where you already have your own forecast, it enters the comparison as another candidate — so you can see where it is already the strongest option. Where you do not, nothing is missing: the core workflow is unchanged.
What makes it different
Model choice happens at SKU level.
Not one method for the portfolio — the strongest performer for each individual series and horizon.
The choice can change.
As the evidence changes, so does the selection. A method that fits an item today is not locked in.
Quality is part of the answer.
Each forecast comes with an assessment of how reliable it is — so you can tell which forecasts are robust enough to support planning and production decisions, and which should be treated with caution.
You learn how much can be forecast at all.
An honest count of which series can support a forecast, rather than an assumption that all of them can.
See it work
Worked example
Illustrative data.
What you engage us to do
Run a forecasting pilot on your own history: the per-SKU model comparison, the selected models, forward forecasts with their reliability assessment, and a review of what the result means for how you plan.
Two ways to work with us
Where the problem is one that recurs across companies, we already have the solution and we run it on your data. Where it is specific to your business, we design and build one around your process, systems and constraints. Same expertise, same technology — only the starting point differs.